Chennai records annual transaction volumes of 5.6 mn sq ft in 2022; highest over the last 10 years: Knight Frank India
- Office completions surged annually by 150% YoY, highest since 2014
Chennai registers annual home sales of 14,248 units in 2022: Knight Frank India
- Average weighted price witnessed a surge of 6% YoY
Chennai, January 10, 2023: In their latest report, Knight Frank India noted that 2022 witnessed a strong momentum for the Chennai office market, recording the city’s best transaction volumes a ten-year period. Strong leasing activities in 2022 helped transaction volumes increase by 45% YoY to 5.6 mn sq ft. Office completions recorded an annual increase of 150% YoY to 4.4 mn sq ft, the highest since 2014. Healthy leasing momentum, increased occupier confidence, and new office supply lead to a surge in average transacted rent by 5% YoY in 2022.
CHENNAI OFFICE MARKET SUMMARY
| Parameter | 2022 | 2022 Change (YoY) | H2 2022 | H2 2022 Change (YoY) |
| Completions in mn sq m (mn sq ft) | 0.41 (4.4) | 150.1% | 0.13 (1.4) | 45% |
| Transactions in mn sq m (mn sq ft) | 0.52 (5.6) | 44.5% | 0.32 (3.5) | 29% |
| Average transacted rent in INR/sq m/month (INR/sq ft/month) | 659 (61.2) | 5.1% |
Note: 1. 1 square metre (sq m) = 10.764 square feet (sq ft)
Source: Knight Frank Research
Chennai’s residential market witnessed stable gainsof 19% YoY, accounting to 14,248 units in the year 2022. In the same time frame, launches rose by 21% YoY, recorded at 5,416 units. The city has been gradually scaling and moving up the ladder since H2 2020. The average price recorded in 2022 in Chennai was INR 4,300/ sq ft resulting in a 6% growth YoY. A substantial boost in consumer sentiment toward home ownership helped to fuel a steady rise in inquiries and conversions from homebuyers around the city as the sales momentum picked up.
CHENNAI RESIDENTIAL MARKET SUMMARY
| Parameter | 2022 | 2022 Change (YoY) | H2 2022 | H2 2022 Change (YoY) |
| Launches (housing units) | 15,416 | 20.6% | 7,846 | 6.6% |
| Sales (housing units) | 14,248 | 19.1% | 7,297 | 17.6% |
| Average price in INR/sq m (INR/sq ft) | INR 46,285 (INR 4,300) | 6.2% | – | – |
Note: 1 square metre (sq m) = 10.764 square feet (sq ft)
Source: Knight Frank Research
Knight Frank India today launched the 18th edition of its flagship half-yearly report – India Real Estate: 2022 – which presents a comprehensive analysis of the residential and office market performance across eight major cities for the July-December 2022 (H2 2022) period.
OFFICE MARKET HIGHLIGHTS OF CHENNAI
From the perspective of half-yearly transactions, Chennai recorded 3.5 mn sq ft of transactions recording a 29% YoY surge in H2 2022. New completions increased by 45% YoY with addition of 1.4 mn sq ft of office space in H2 2022.
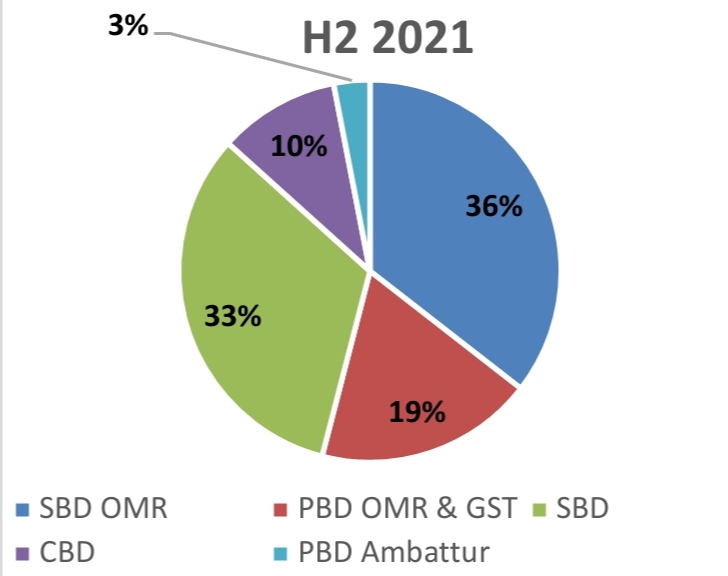
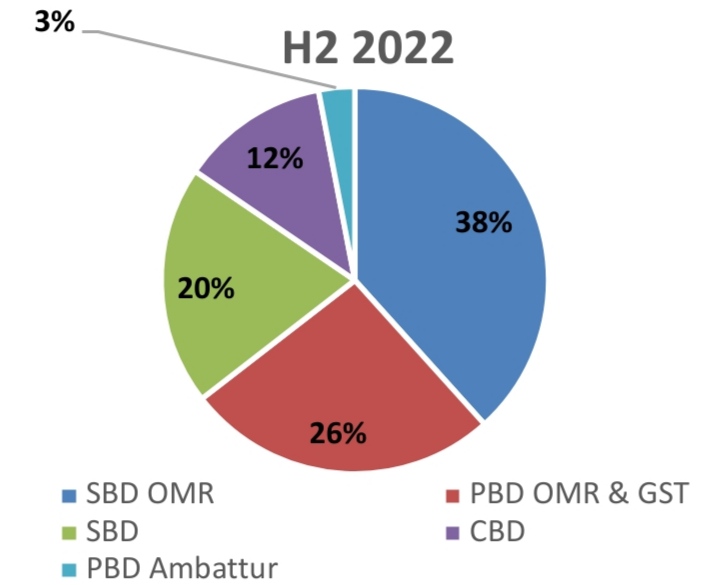
SBD-Old Mahabalipuram Road (SBD OMR) dominated transaction trends with 38% of the total transactions in H2 2022. Peripheral Business District (PBD)-OMR and Grand Southern Trunk Road (GST) increased momentum with share increasing from 19% in H2 2021 to 26% in H2 2022. Central Business District (CBD and Off CBD) also recorded a marginal rise in share of total transactions from 10% in H2 2021 to 12% in H2 2022. Whereas the micro market of Suburban Business District (SBD) registered a decline from 33% in H2 2021 to 20% in H2 2022.
Business district wise transactions split in H2 2021 and H2 2022
Source: Knight Frank Research
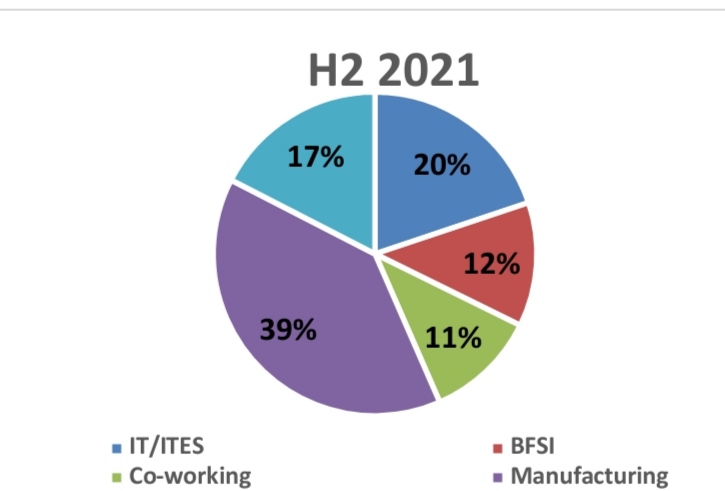
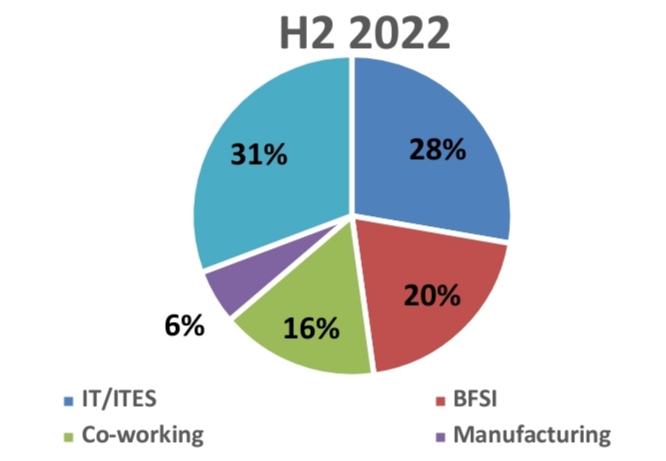
IT sector remained the market’s backbone in H2 2022, contributing 30% of leasing activity. As Chennai continues to draw significant IT companies, this is a highly encouraging sign for the market there.
With major corporations like Wells Fargo and Bank of America taking office space in the city, BFSI sector became the second-largest contributor. BFSI accounted for 20% of total transactions. The co-working industry continued to grow, taking up 16% of the total amount of space in H2 2022. The two most active co-working companies at the time were Workez and CoWrks.
Sector-wise transactions split in H2 2021 and H2 2022
Note: BFSI includes BFSI support services
Source: Knight Frank Research
Srinivas Anikipatti, Senior Director- Tamil Nadu & Kerala at Knight Frank India said, “The year 2022 proved to be a great year for the Chennai office market with surge in transactions volumes reaching remarkable new highs. The market fostered a broad tenant base that supported demand in a challenging environment.IT sector and co-working spaces maintained their momentum in transaction volumes with some of the large deal registered in the city. Chennai also observed demand from start-ups and higher queries from healthcare occupiers in H2 2022.”
RESIDENTIAL MARKET HIGHLIGHTS OF CHENNAI
In H2 2022 Chennai’s residential market registered sale of 7,297 units registering a growth of 18% YoY in H2 2022. The effects of rising interest rates and recessionary fears have been less severe in Chennai because of the city’s development as an IT centre and the number of job opportunities it has created. In tandem to the home-buyers’ sentiments, developers too launched various projects to capture the on-going optimistic wave. New launches in the city were recorded at 7,846 units in H2 2022, a 7% YoY increase in H2 2022.
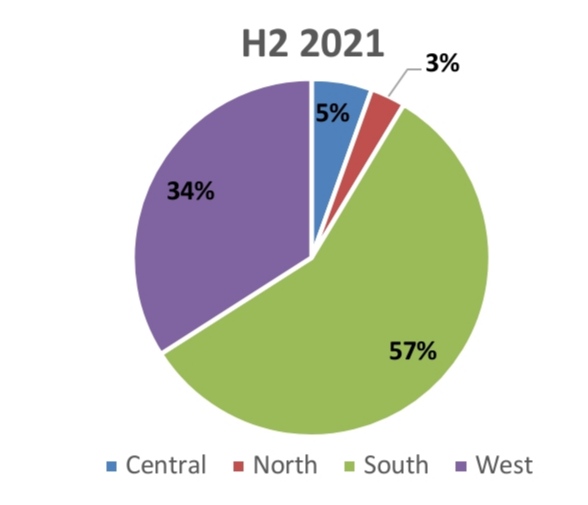
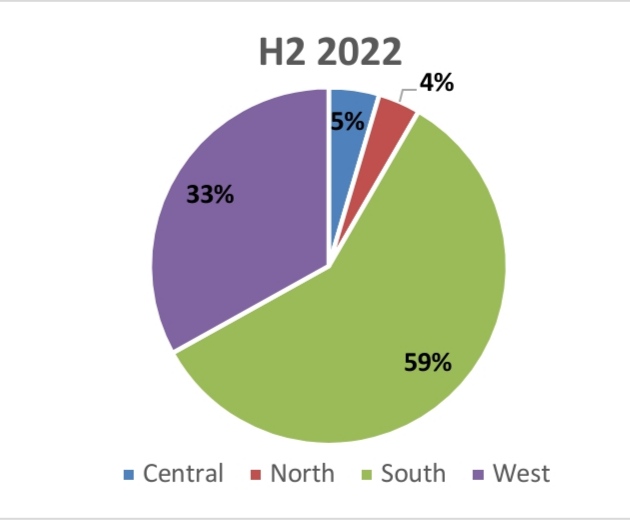
The micro-markets of South and West together accounted for 92% of total sales during the period. The more affordable locations like Porur, Valasaravakkam, and Poonamalle in the west made up 33% of the overall share, while Micro-markets in the south between OMR and GST Roads continued to draw the majority of homebuyer interest (59% of the total share). Increased development activity was observed in places like Pudur, Perumbbur, Kolapakkam, and Tiruvottiyur during H2 2022.
Micro-market split of sales in H2 2021 and H2 2022
Source: Knight Frank Research
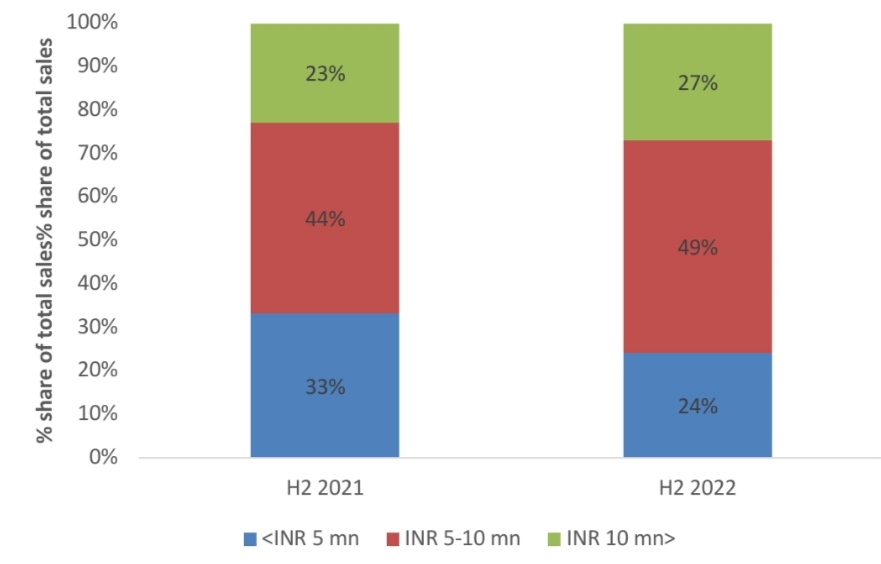
The ticket segment of INR 5–10 mn continued to dominate the sales volume in H2 2022. The segment’s share increased substantially from 44% in H2 2021 to 49% in H2 2022. Higher ticket size segment i.e. over INR 10 mn also witnessed an increase to 27% in H2 2022 from 23% in the preceding year. Homebuyers have become more likely to look at houses in outlying places that were previously off their radar to get larger spaces with better amenities and to increase the standard of living generally.
Chennai ticket size split comparison of sales during H2 2021 and H2 2022
Source: Knight Frank Research
Residential demand was more focused towards ready-to-move-in properties, which helped in the decline in quarters to sell (QTS) from 14.3 quarters to 11.3 quarters in H2 2022. The average weighted price also increased by 6% YoY in H2 2022. This price increase can be interpreted as a sign of regaining sales momentum.
Srinivas Anikipatti, Senior Director- Tamil Nadu & Kerala at Knight Frank India said, “The residential market in Chennai has been gradually improving since H2 2020. Strong sales momentum and increase in number of inquiries from homebuyers, helped along by a sharp improvement in consumer sentiment towards home ownership in the city. To acquire larger spaces with better amenities and to raise the standard of living generally, homebuyers have grown more inclined to look into houses in peripheral areas that were previously off their radar. Due to better market conditions and a significant number of forthcoming developments, the city will continue to grow strongly throughout the next quarters.”

